🛒 Available on the Microsoft Store — try free for 7 days, then buy once and own it forever. Get it on Microsoft Store →
7-day free trial — Available on Microsoft Store

Test any what-if.
Never break the
model that works.

Every scenario in TreBranch is a safe, live copy of your model. Change three cells in the copy — everything else stays connected to the original. The version that works is always one click away.

Sold exclusively on the Microsoft Store · Buy once, own forever
A B C D
Join analysts, consultants, and owners who stopped copying tabs
TreBranch — scenario branches with live key metrics in the sidebar

You know this folder. TreBranch is one file, and every scenario you ever tried lives inside it.

100%
offline — no cloud, no sync
300+
formulas supported
7
day free trial, then buy once
scenarios in one file
Try it right here

Feel it work. No download.

A toy 3-year deal model, live on this page. Click a scenario, nudge an assumption, and trace a difference to the exact assumption that caused it — the real mechanics of the app.

Scenarios
Revenue growth (%/yr) trunk 8%
EBITDA margin (%) trunk 25%
Revenue · Yr 3
EBITDA · Yr 3
Equity IRR
Click a scenario, or edit an assumption with the +/− steppers.
⚄ Now shake it Monte Carlo on the scenario you selected
Equity IRR distribution. Drag a slider — 2,000 fresh trials on every move. The real app does this over your whole model.

See it in action

25 seconds. Zero copy-sheets.

Click through scenarios, compare two of them down to the driving assumption, flip on dark mode, and run a Monte Carlo risk simulation — recorded live from the app.

Recorded from the real app · no mockups — unmute for narration 🔊
For PE · IB · FP&A

The deal-case workflow, end to end.

Walk an LBO's case fan — Base, Buy-and-Build, Bull/Bear exits — with Gross IRR and MOIC live on every scenario. Compare Base vs Bear down to the leverage assumption, open the Decision Sheet for the IC, then stress a project-finance model's DSCR with a 2,000-trial Monte Carlo.

Project Cardinal LBO & solar project finance · dark mode — unmute for narration 🔊
Why analysts switch

Root-cause it. Stress-test it. Decide.

The three tools that turn a pile of scenario tabs into an actual decision — and that no copy-sheet workflow can do at all.

Also in v5: Multi-sheet Live charts Dark mode Print / PDF Cell formatting Live-formula Excel export
Scenario Comparison — 3 changed assumptions drive 50 differing outputs, each traced to its driver
Compare

Root-cause any difference

Bull vs Bear differs by $14M — but why? Compare any two scenarios and TreBranch lists every changed assumption and every output it drives, each difference traced to the exact cell that caused it. No more Ctrl+F across eight tabs.

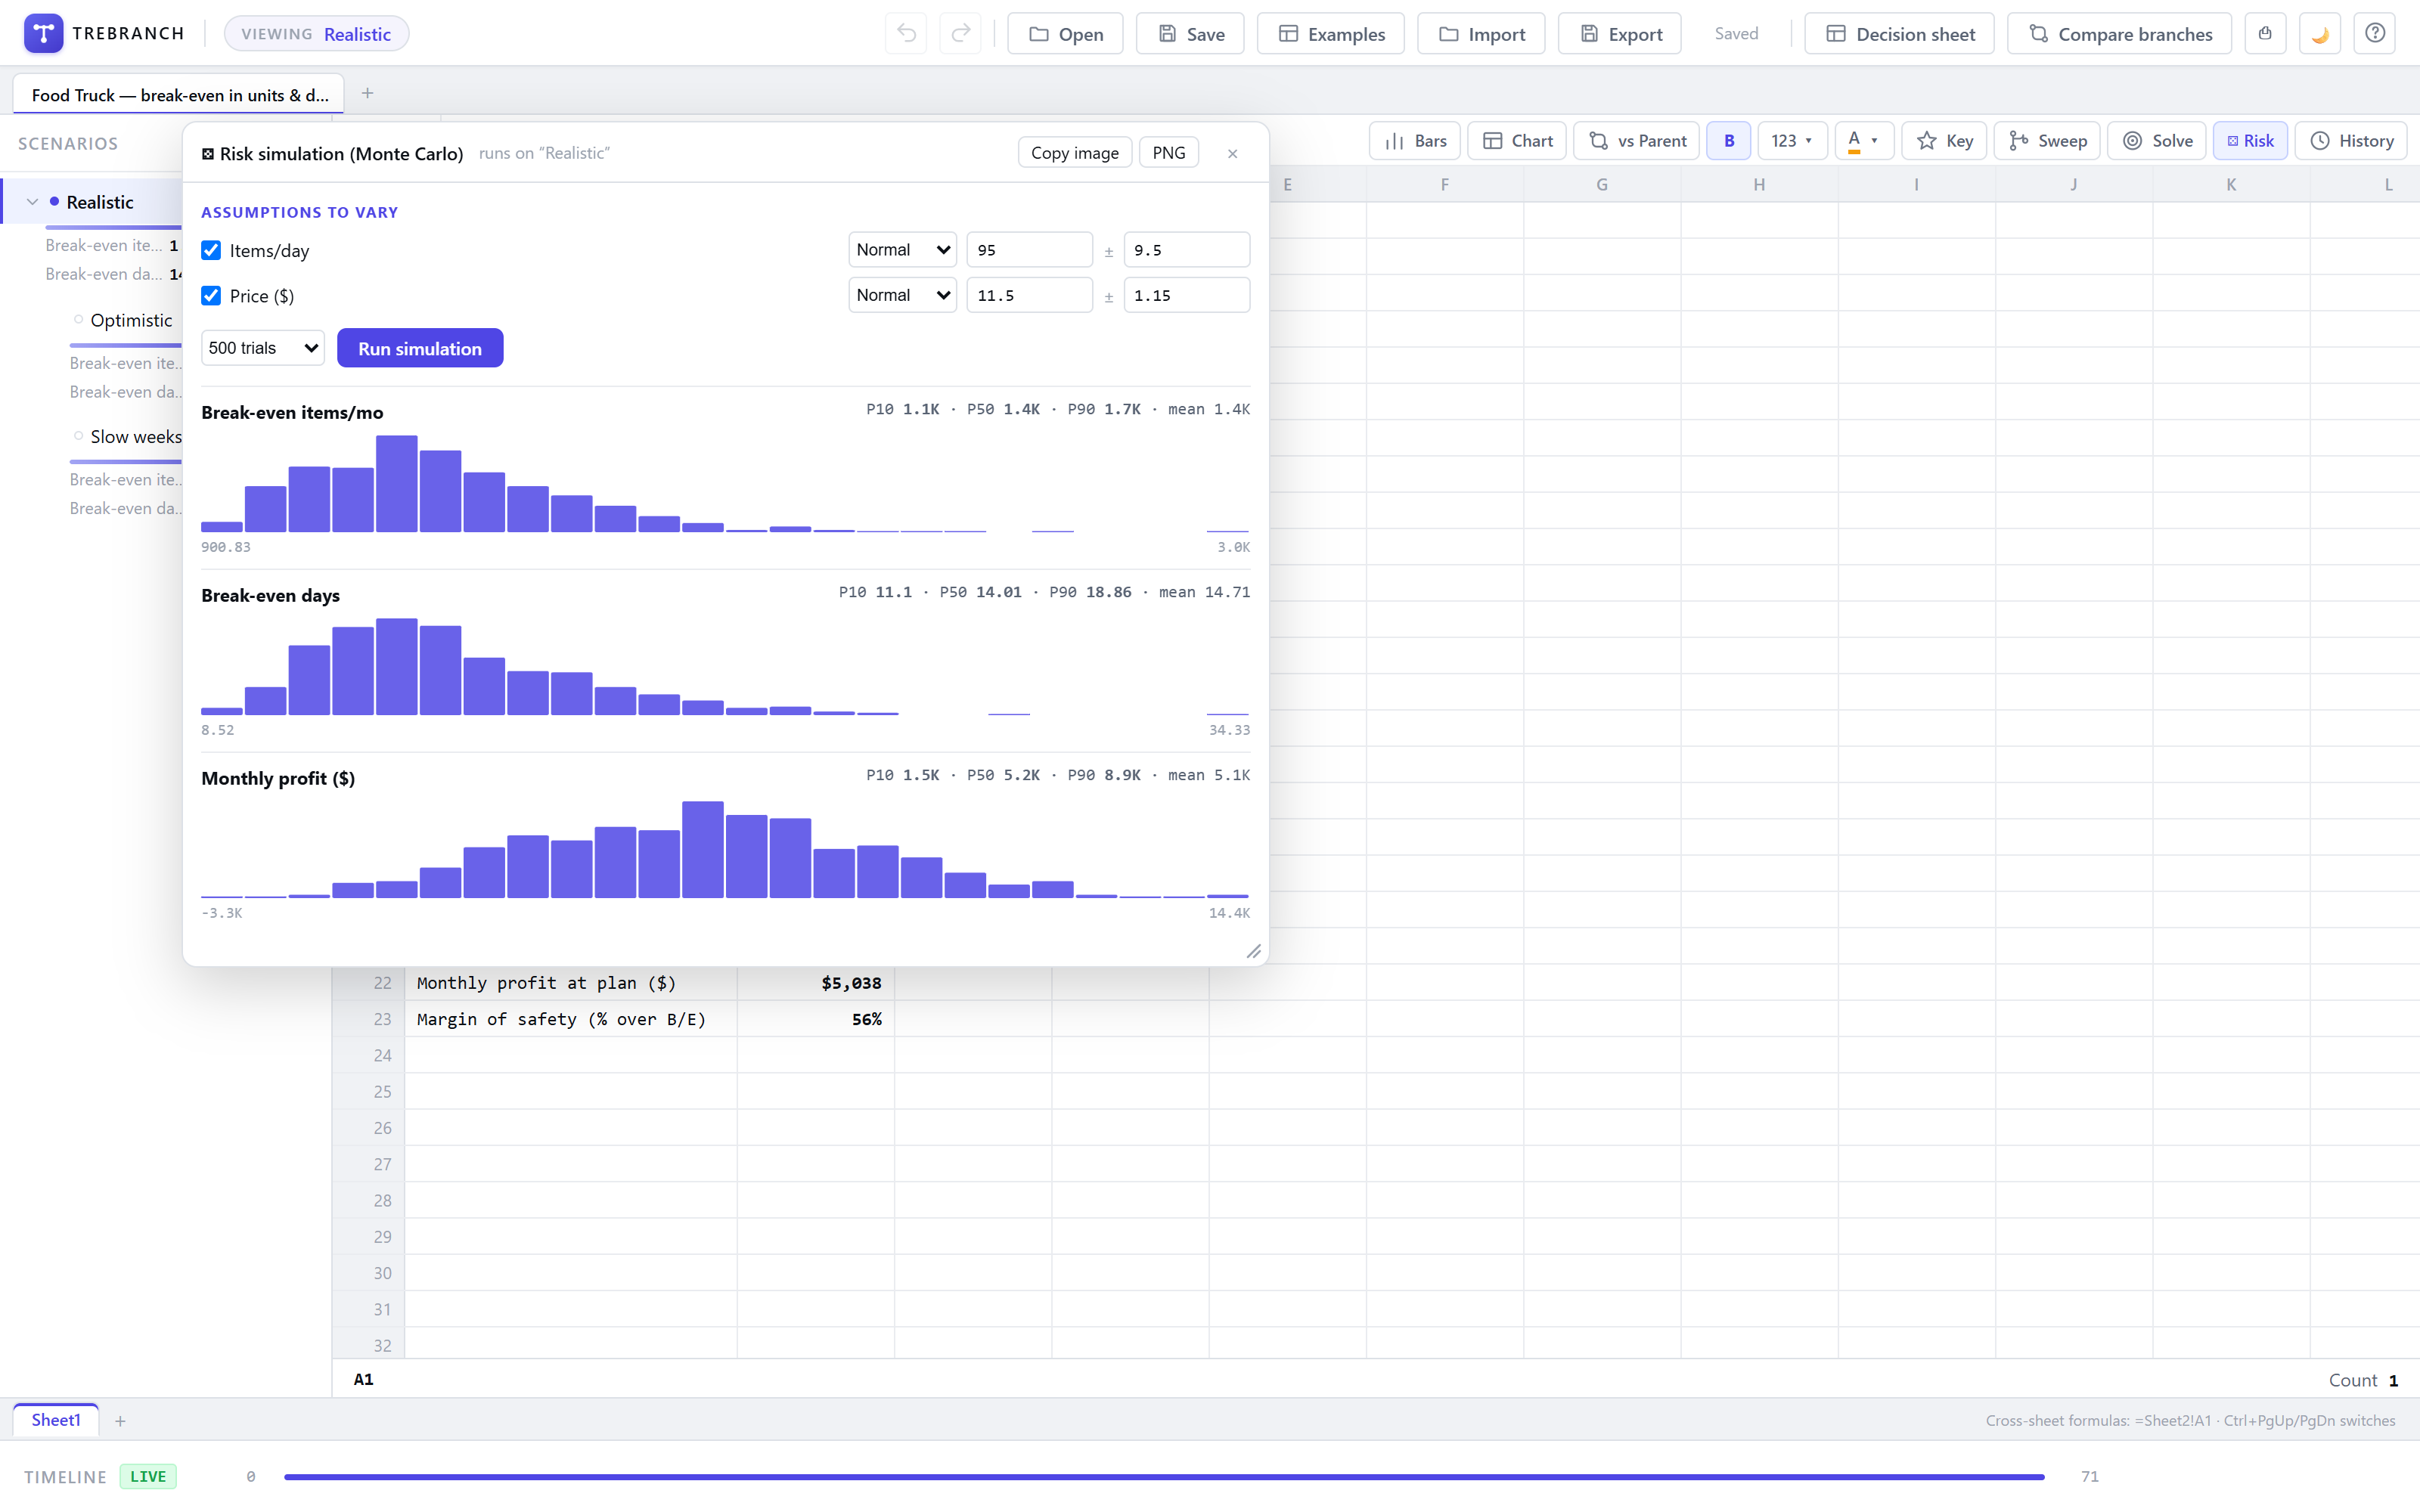
Risk simulation (Monte Carlo) — P10/P50/P90 histograms for every key output
⚄ Risk

Monte Carlo risk simulation

Give your key assumptions a range — normal, uniform, or triangular — and run thousands of trials. Read P10 / P50 / P90 for every key output with live histograms. The analysis that needs a paid add-in in other spreadsheets, built in.

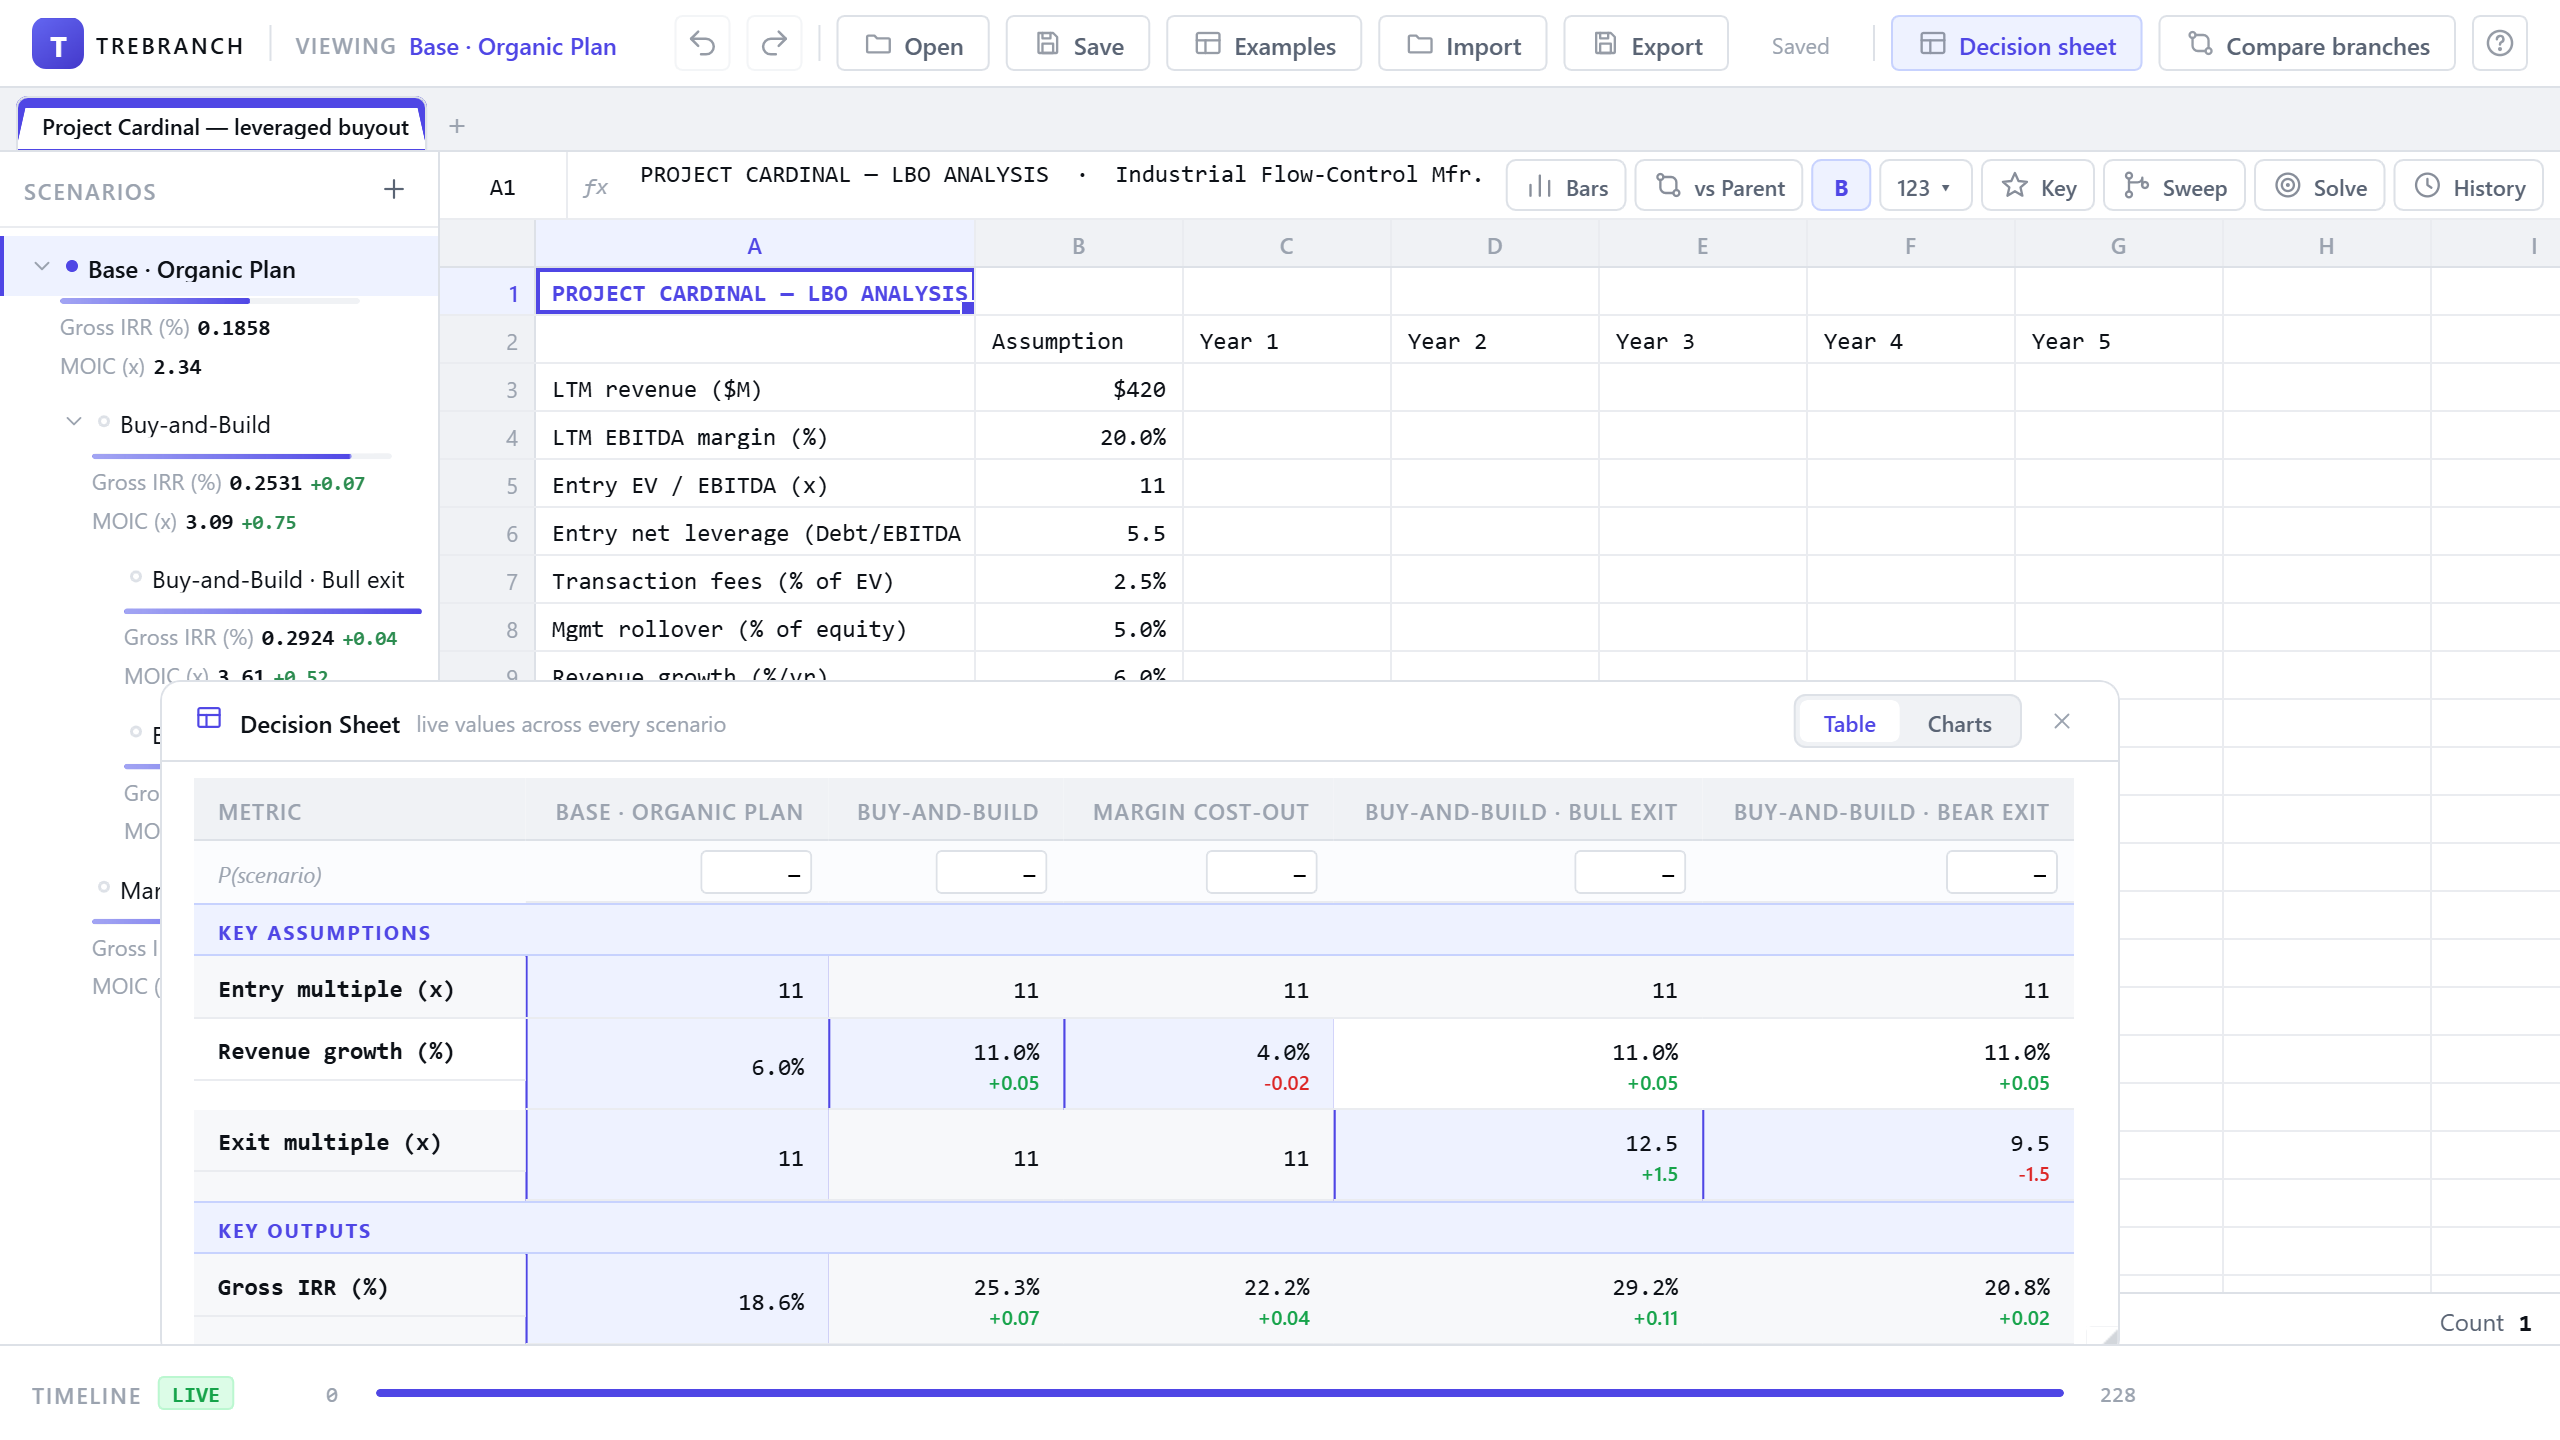
Decision Sheet — every scenario side-by-side with key assumptions and outputs
Decide

Every scenario, one view

The Decision Sheet lines up all your scenarios side-by-side — key assumptions, key outputs, live values, probability-weighted expected value. The exhibit you'd spend an hour building by hand, generated in one click and never stale.


Screenshots

The app, up close.

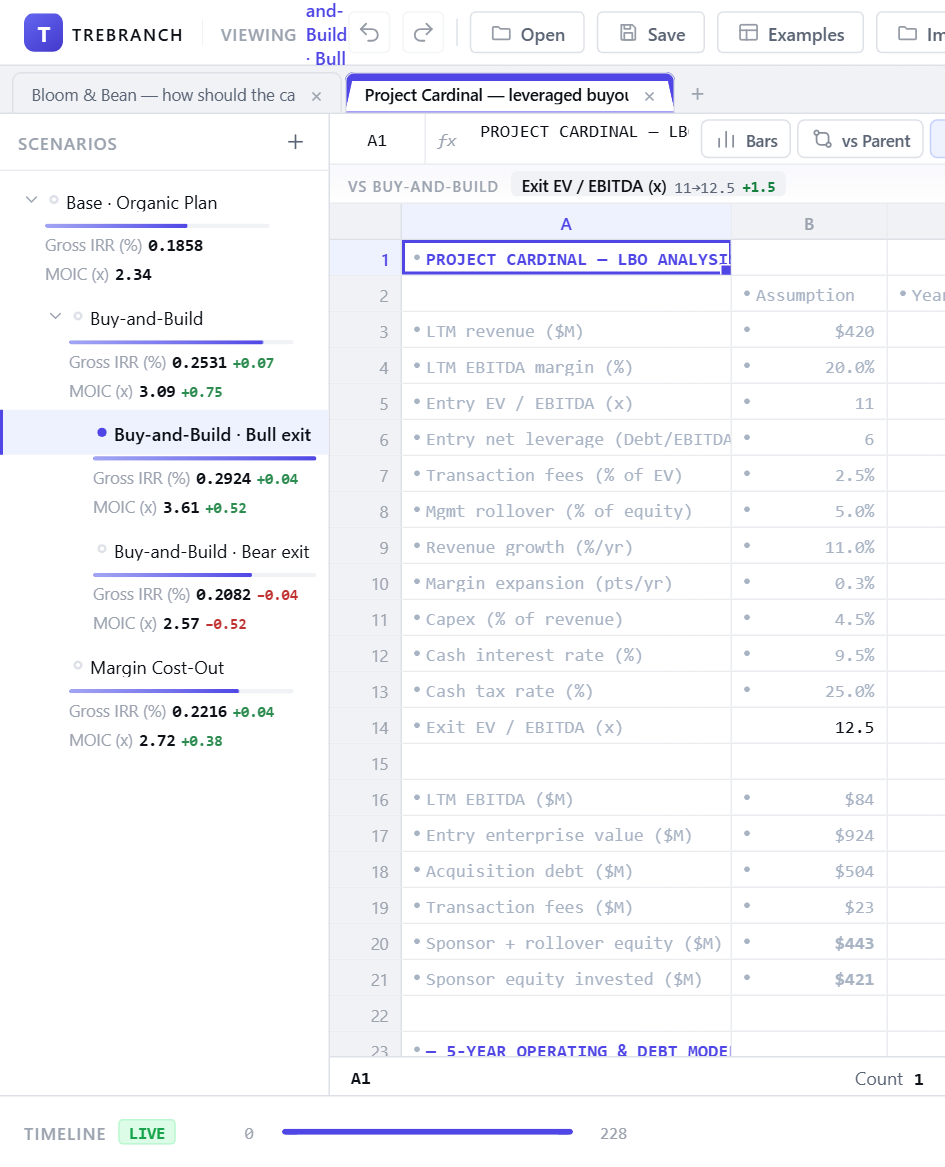
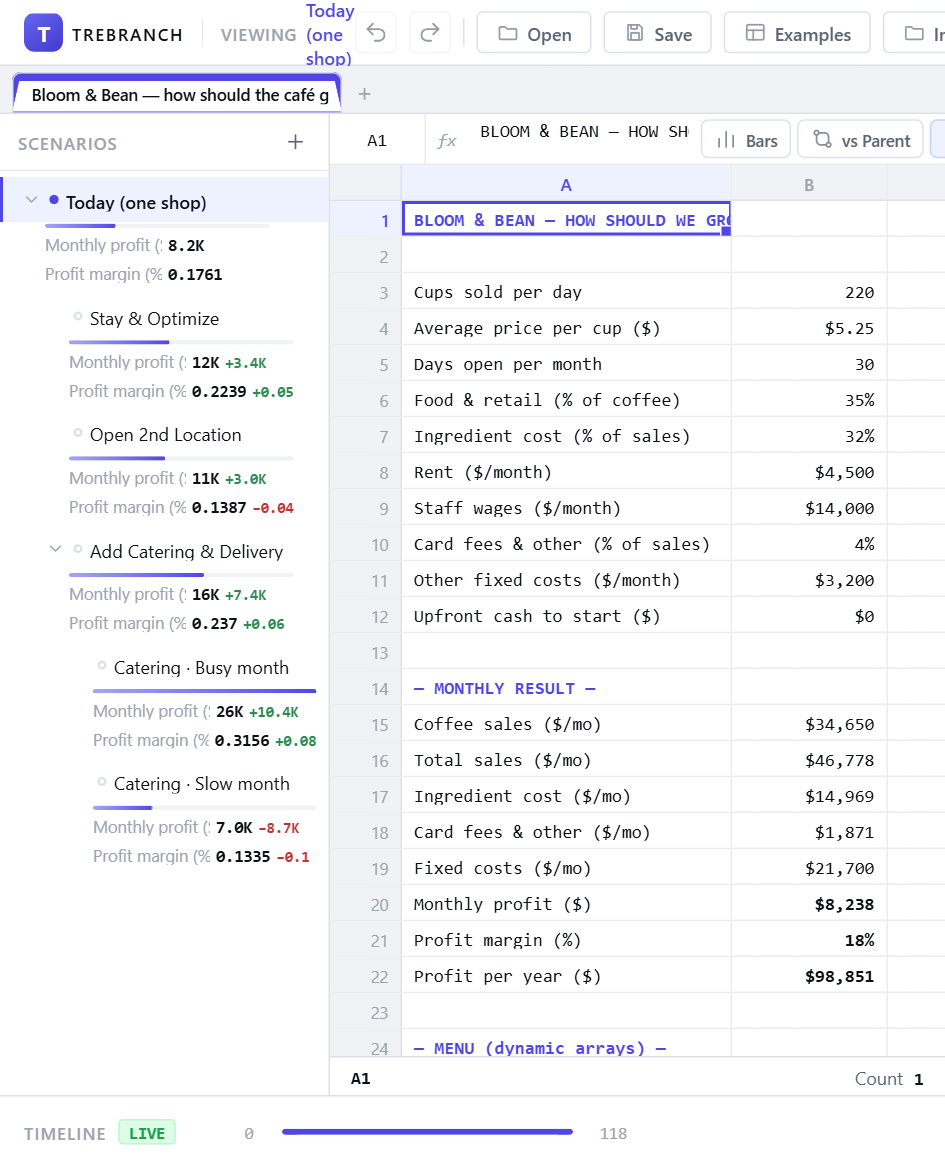
Bloom & Bean — scenario tree with live Key Metrics per branch

Scenario Tree & Key Metrics

Every scenario shows its Key Metrics inline — profit, margin, payback — with deltas vs its parent

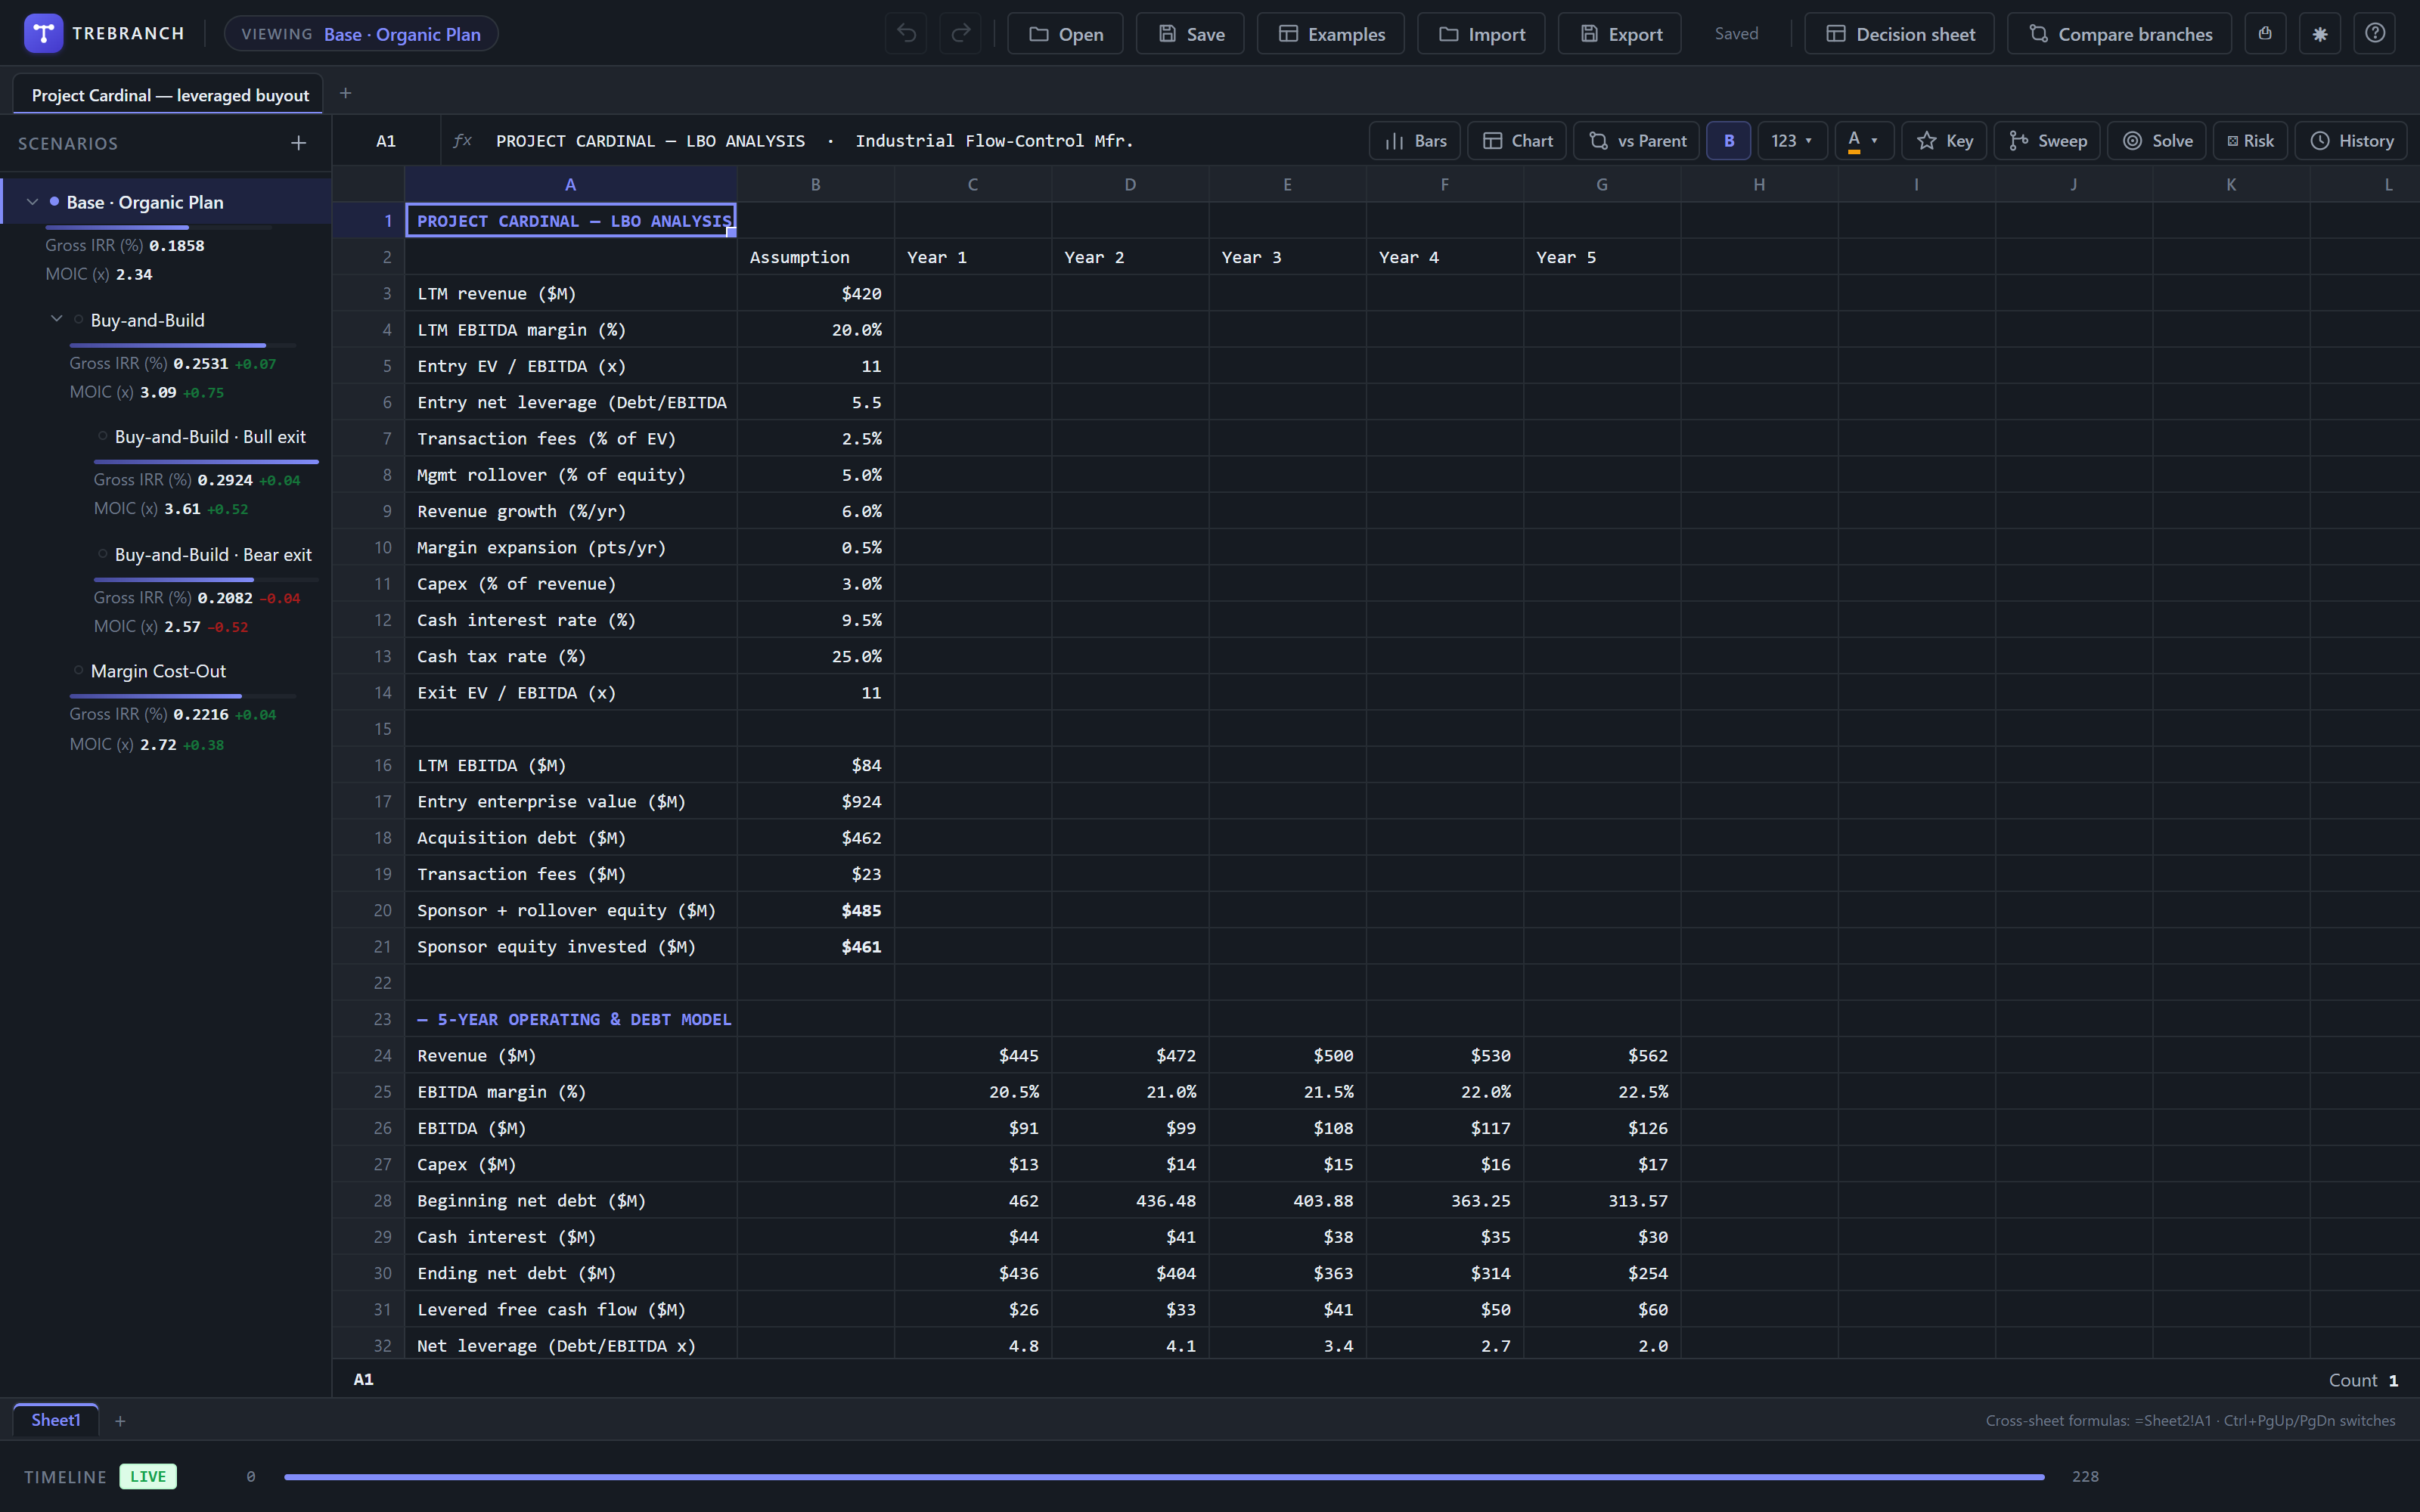
Dark mode — Project Cardinal LBO with Bull/Bear exits and Gross IRR per branch

Dark Mode — LBO Analysis

Project Cardinal — Base, Buy-and-Build, Bull/Bear exits with Gross IRR & MOIC per scenario, in dark mode

Risk simulation — Monte Carlo histograms with P10/P50/P90 per output

Risk Simulation (Monte Carlo)

Shake the assumptions, read the distribution — P10 / P50 / P90 and a live histogram for every key output

Scenario Comparison — 3 changed assumptions drive 50 differing outputs

Compare Scenarios

"3 changed assumptions drive 50 differing outputs" — every difference traced to the assumption driving it

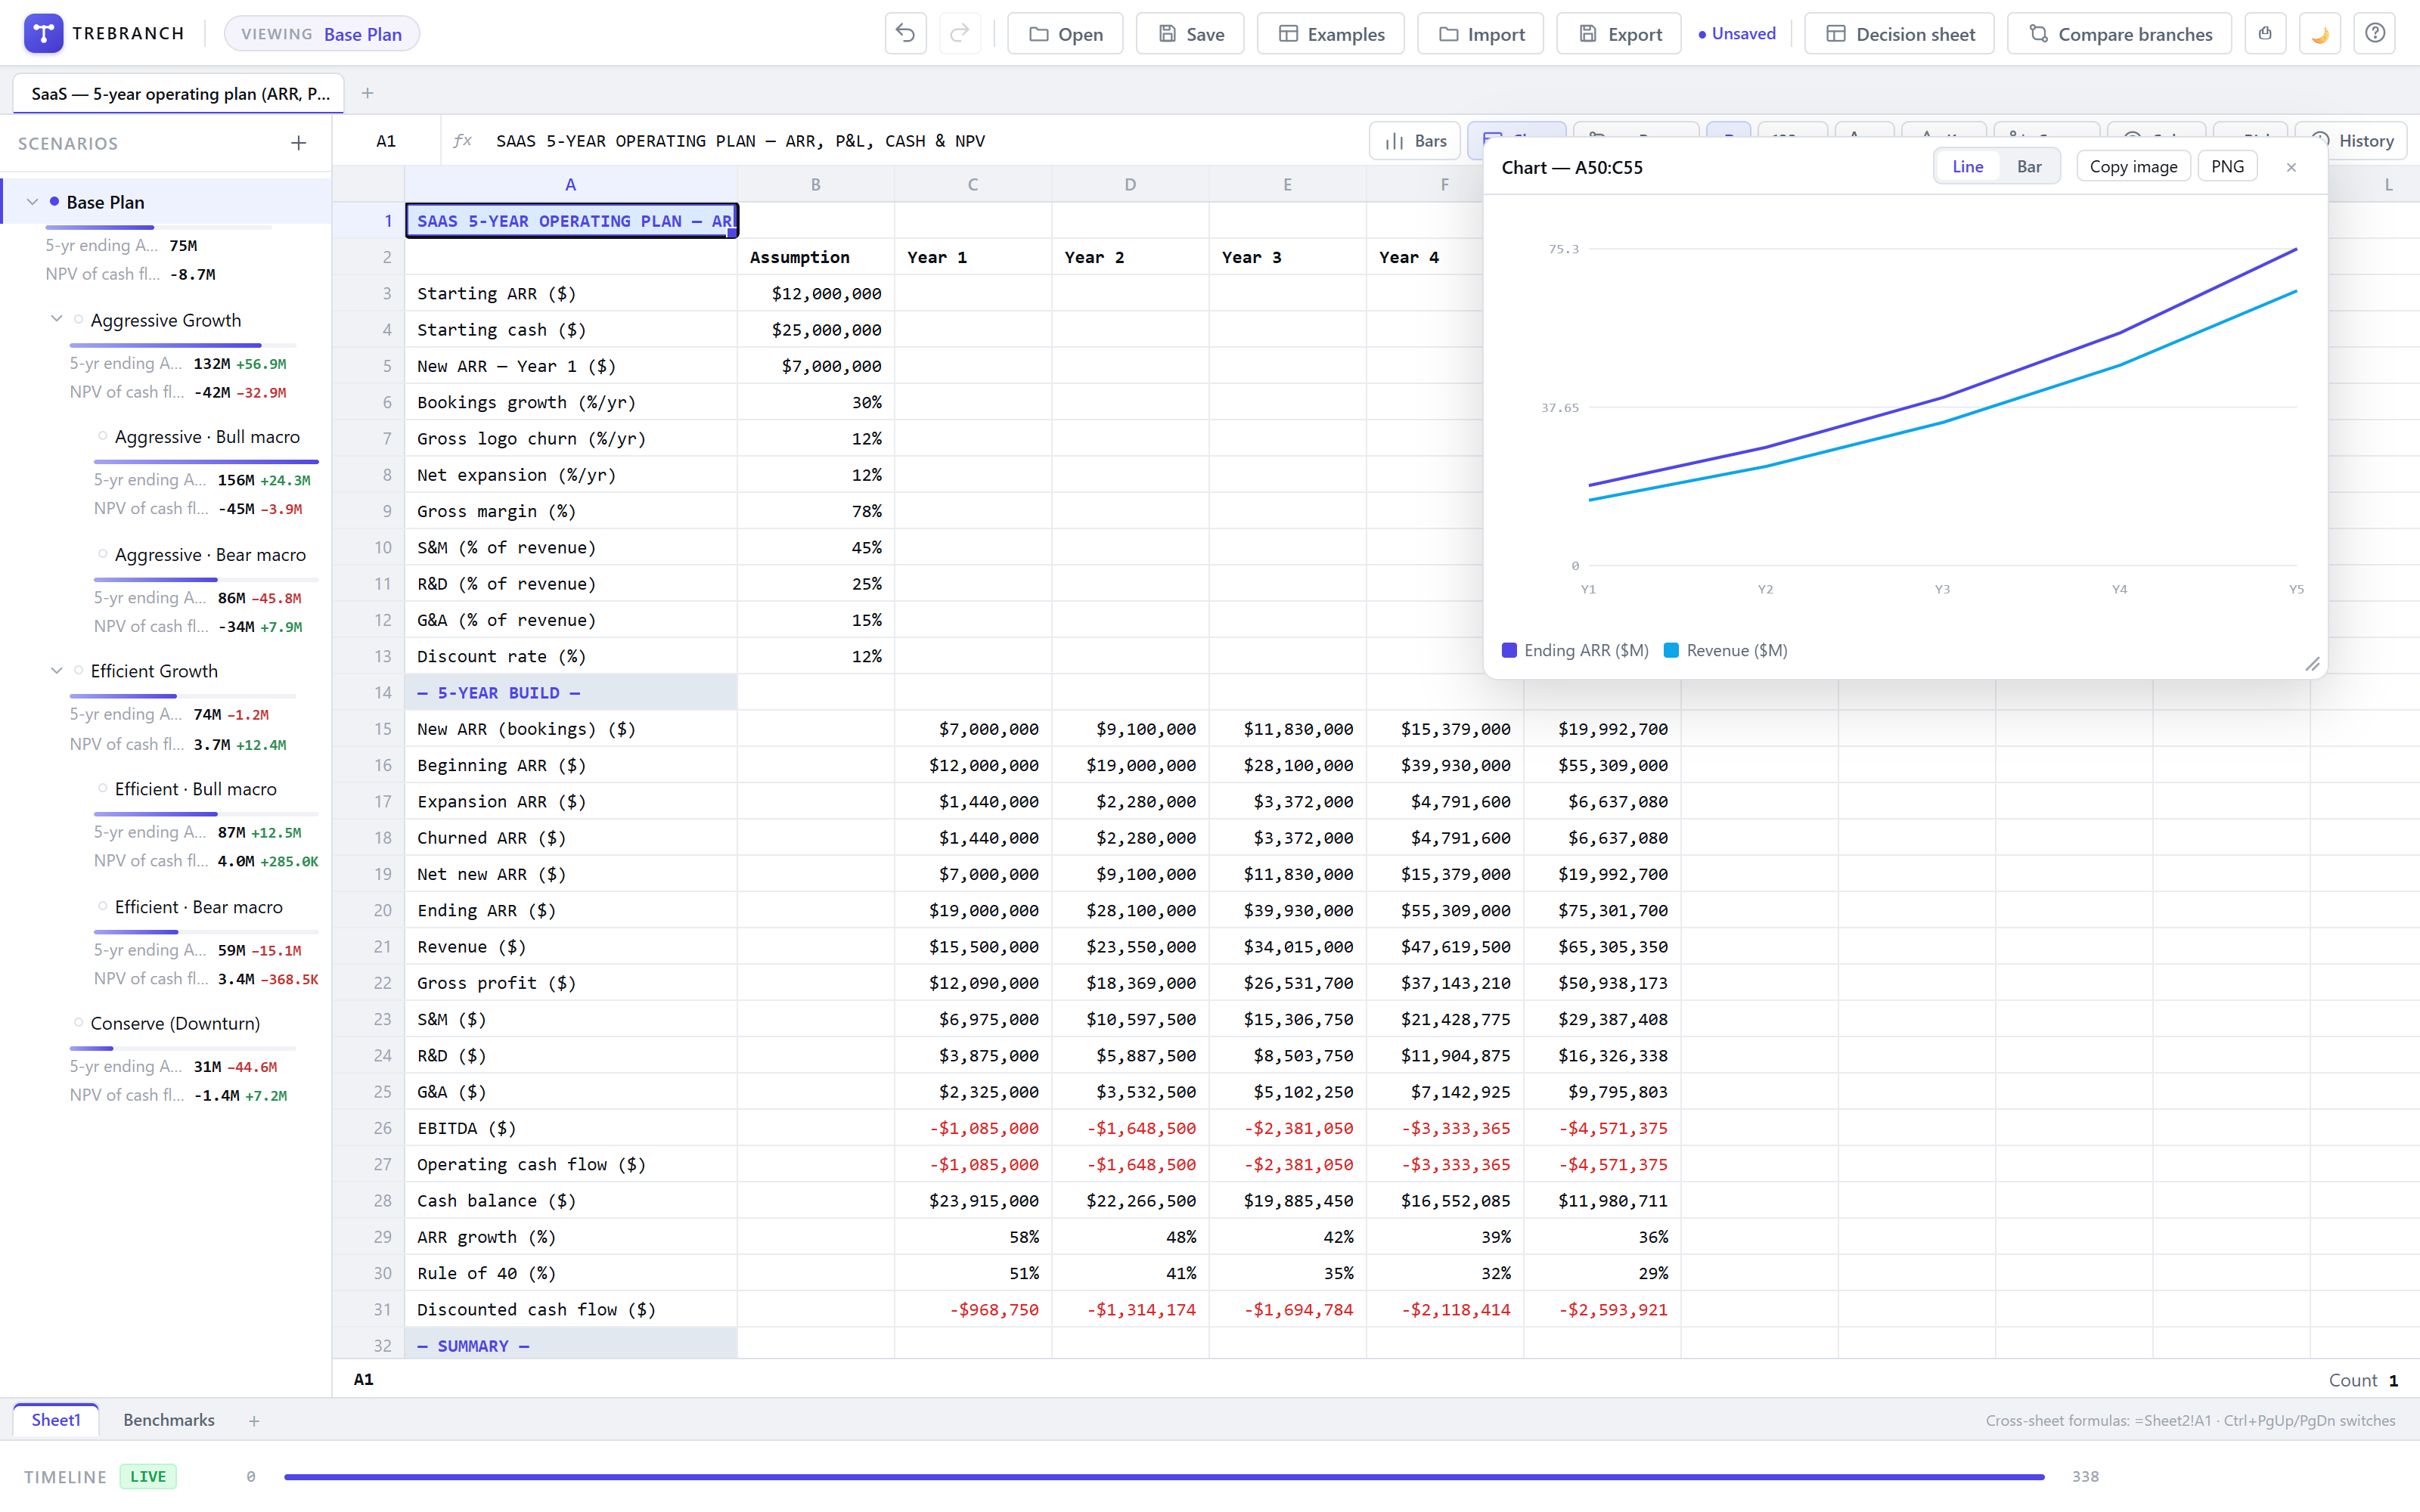
Live chart — ARR and Revenue over 5 years floating over the SaaS model

Live Charts

Chart any range — a floating line or bar chart that recalculates as the model changes

Decision Sheet — all hospital scenarios side-by-side

Decision Sheet

All scenarios side-by-side with live values — Key Assumptions and Key Outputs in one shareable panel

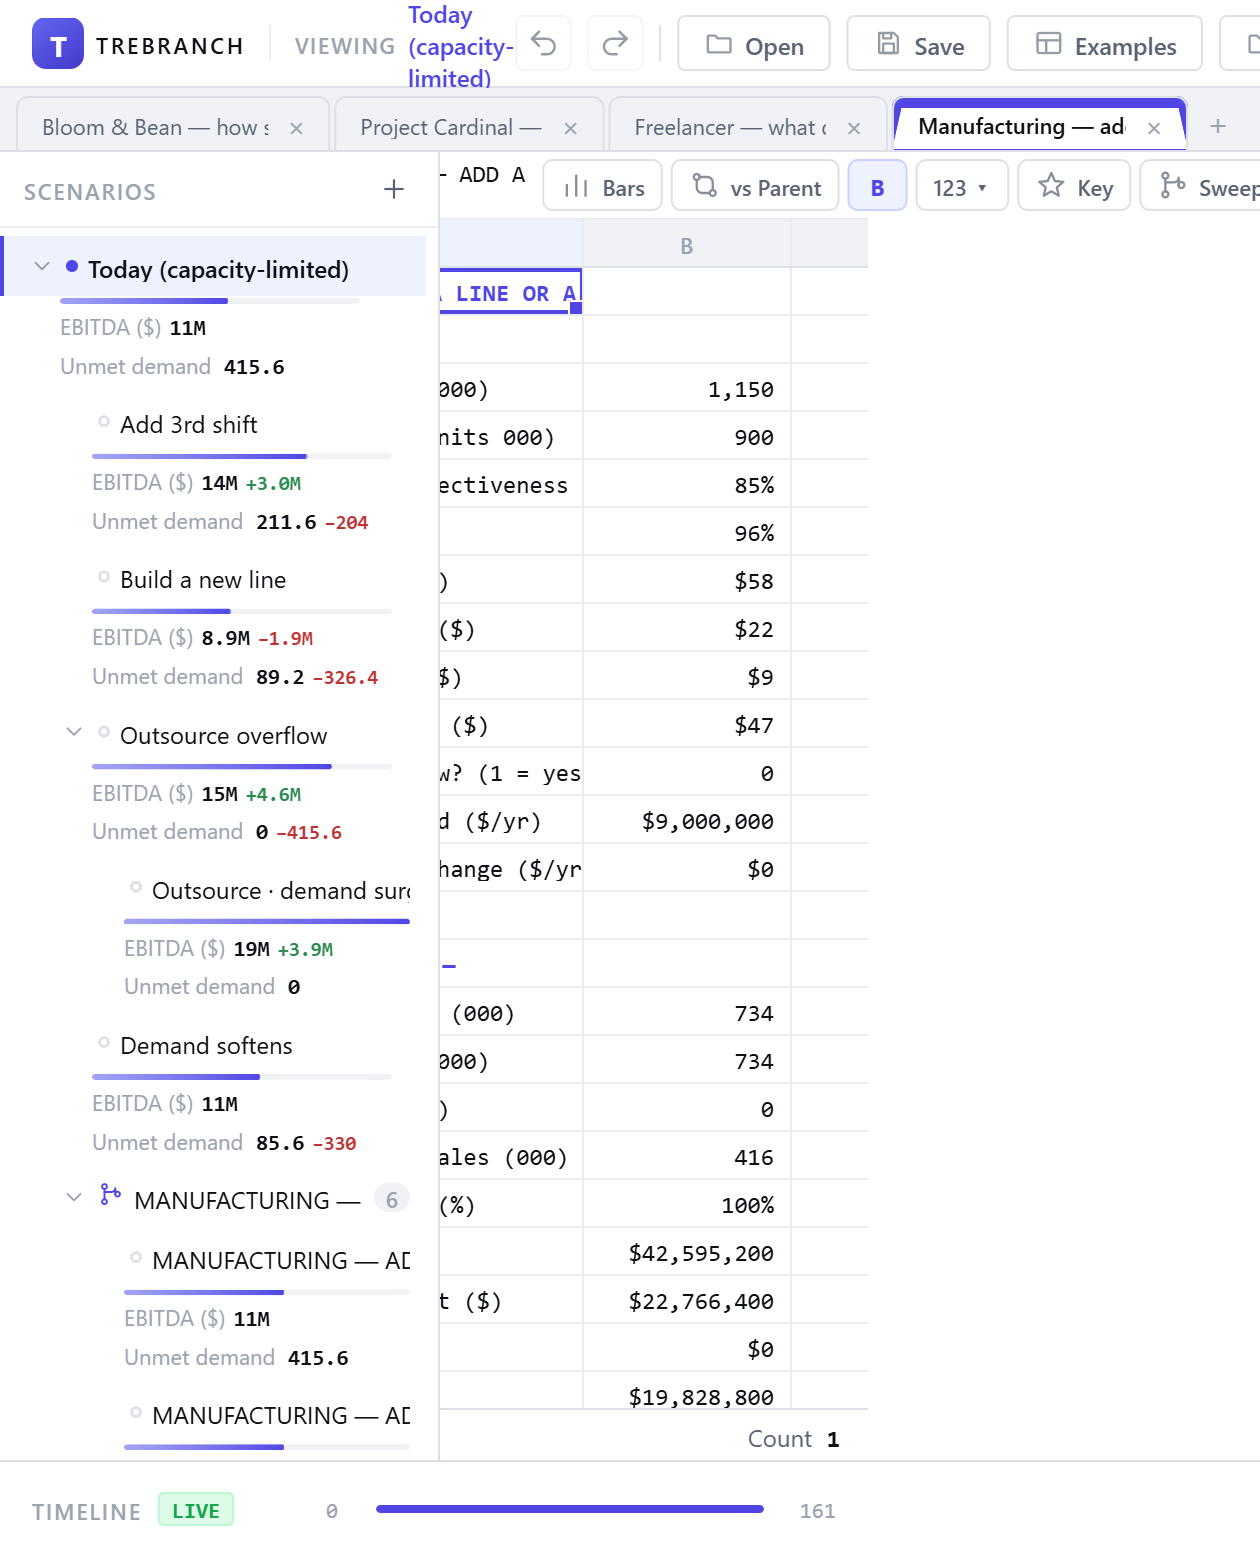
Manufacturing model with Sensitivity Sweep branches

Sensitivity Sweep

One input, a full family of scenarios — TreBranch sweeps a range and creates every one in seconds

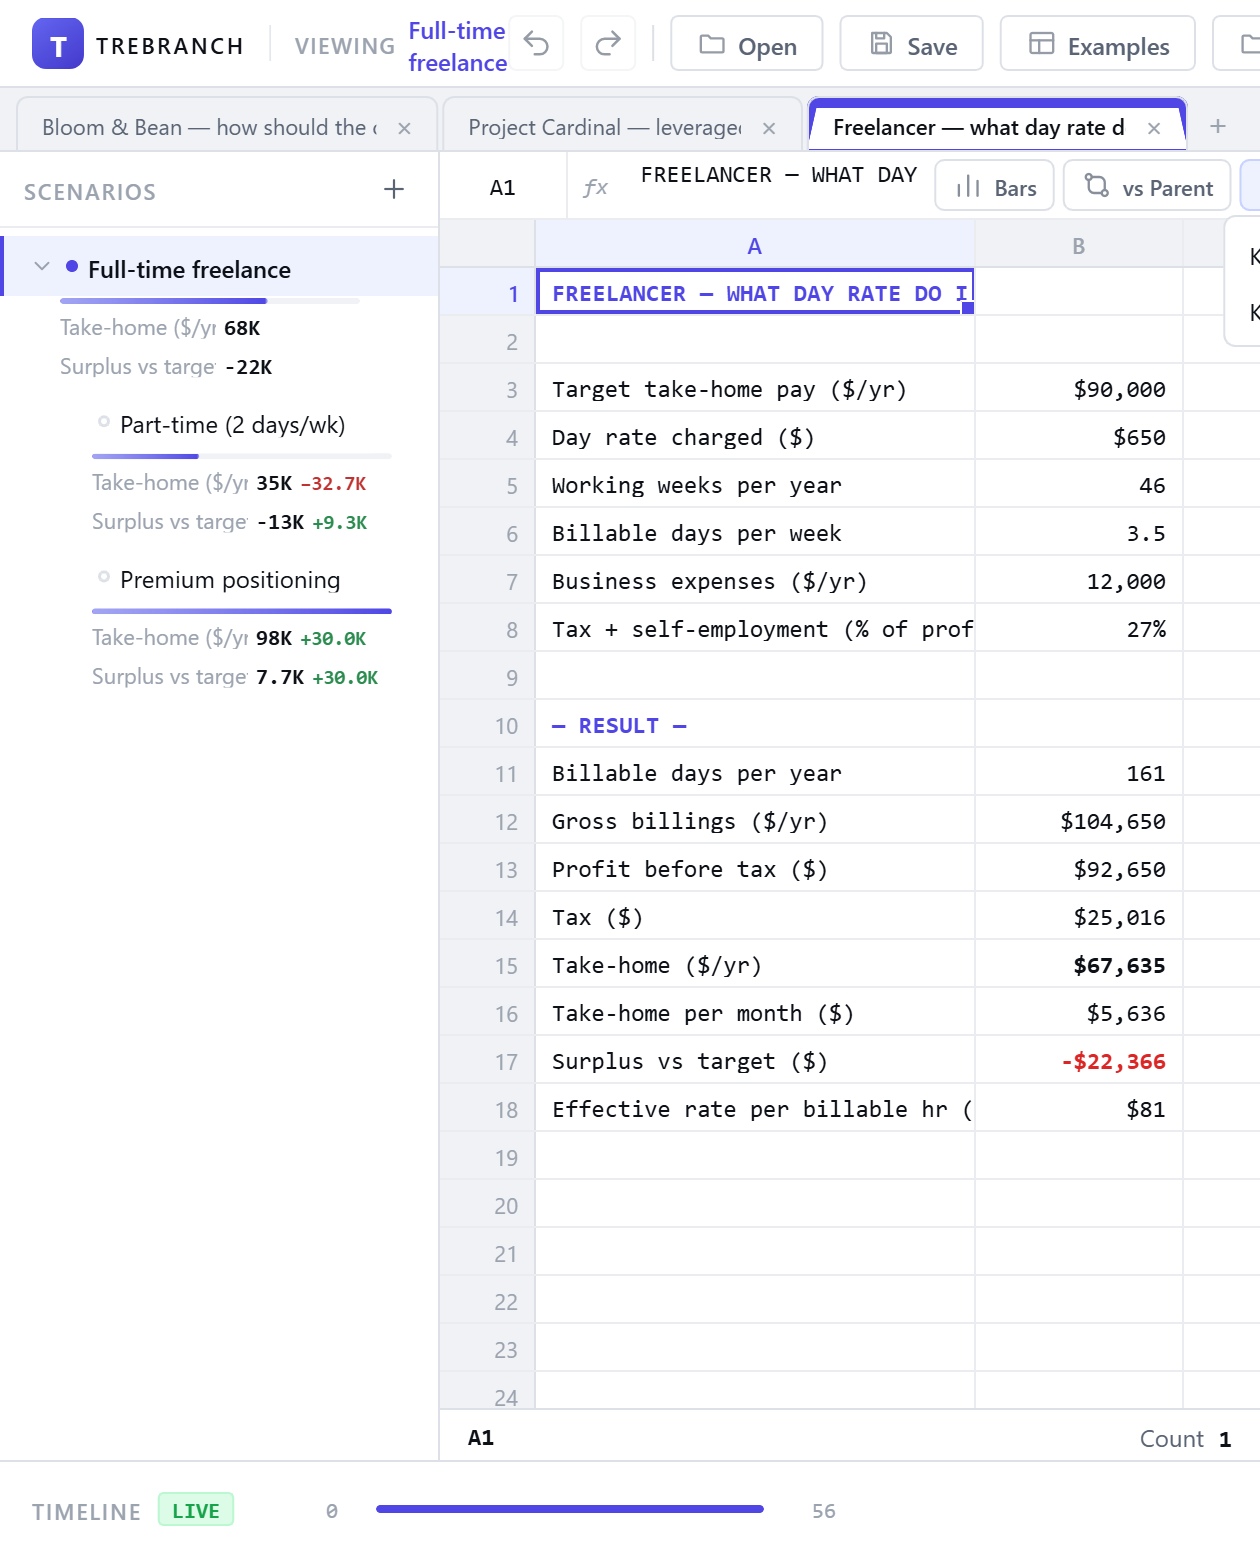
Freelancer model with Key Metrics panel open

Freelancer Scenarios

Full-time, part-time, and premium positioning — revenue & margin for each scenario at a glance

drag to browse · click to zoom
Built for teams that live in spreadsheets
The Problem

The copy-sheet trap is costing you hours.

Every analyst knows the drill: Base_Case_v3_FINAL_USE_THIS.xlsx.

📋

Copy-sheet chaos

Scenarios drift. A fix on one sheet never makes it to the others. You're maintaining five models simultaneously.

🔍

Can't find the driver

Bull vs Bear differs by $14M. But where? You're Ctrl+F-ing across 8 tabs trying to find the one cell that changed.

No way back in time

Your LP asked "what did the model look like at signing?" — that version is gone, buried under 40 saves.

The TreBranch Way

One model. Infinite scenarios.

Every scenario is a safe, live copy of your model. Change one cell and only that cell differs — everything else stays connected to the original. Compare any two scenarios and see the exact assumption that caused the difference, in one click.

Scenarios, not copies. Every cell stays connected unless you change it.
Compare any two scenarios — the cause, in seconds.
Go back to any moment in your model's history.
Decision Sheet lines up every scenario side-by-side.
Sensitivity sweep — ten scenarios from one input, in seconds.
How it works

It works like a tree — not a pile of copies.

Three simple ideas that will change how you model forever.

Scenarios, not copies

Create a "what if?" in one click

Picture a tree. Your original spreadsheet is the trunk. A scenario is a "what if?" — like "what if we open a second location?" When you create one, it starts as an exact copy. Change one cell and only that cell is different. Everything else stays connected to the original. Fix a mistake in the trunk? It fixes in every scenario automatically.

Live copies One tree Stays connected
Base Case growth: 8% margin: 25%
Bull Case growth: 12% ↑ margin: 25% ←
High Leverage growth: 12% ← margin: 28% ↑
Bear Case growth: 4% ↓ margin: 25% ←
↑ overridden   ← inherited from parent
Compare to the cause

Find exactly what changed — in seconds

Open any two scenarios side-by-side and TreBranch shows every number that's different — then highlights the one cell that caused it all. It's like a detective that finds the one clue that explains the whole case. No more hunting across 8 tabs trying to figure out why the numbers are different.

Compare Root-cause tracing Full history
Bear Case vs Bull Case 3 overrides · 1 root cause
Cell Bull Bear Delta
★ Growth Rate (root cause) 12.0% 4.0% −8pp
Revenue Y3 125.4 108.2 −17.2
EBITDA Y3 35.1 27.1 −8.0
IRR 24.3% 14.7% −9.6pp
Go back in time

Go back to any version of your model

TreBranch remembers every cell change you've ever made — like a video game save file. Need to see what the model looked like before last week's assumptions changed? Just scroll the history. Found it? Turn that old snapshot into a brand new scenario — without losing any of your current work.

Time scrubber Historical fork Event log
🕘 Model History — Base Case
Today Growth Rate → 8.0% Current
Jun 3 EBITDA Margin → 25.0%
May 29 Entry Multiple → 8.5x
★ Signing Deal parameters locked
Features

Everything a serious modeler needs.

No half-measures. No browser tab. Full desktop power with a spreadsheet you actually understand.

Unlimited scenarios

Create as many scenarios as you need. The tree is always your source of truth — and scenarios can never leak into each other.

🔍

Compare

A floating panel shows every cell that differs between any two scenarios, sorted by impact, traced to the root assumption.

★ Sensitivity Sweep

Pick any input cell, define a range, hit Sweep — TreBranch auto-generates a full family of scenarios with charts ready.

🎯

⊙ Goal Seek

Set a target output and let TreBranch back-solve for the input. Works in every scenario, with the full history kept.

📊

Decision Sheet

Auto-generated side-by-side comparison of every scenario with charts, delta bars, and probability weighting.

🕘

Full history

Every cell change is recorded. Scrub back in time, start a new scenario from any past state, audit the full change log.

📐

Power formulas

FILTER, UNIQUE, SORT, XLOOKUP, XLOOKUPALL, MEDIANIFS, STDEVIFS, WAVERAGE, REGEX*, DATEADD, dynamic array spill.

📦

Native .trebranch files

Save, open, and share files locally. Works fully offline. No cloud dependency — your model stays yours.

🔒

100% Offline

No cloud, no sync, no subscription. Your models stay on your machine. Works on a plane, in a data room, or anywhere with no internet.

📥

Import CSV & Excel

Open any .csv or .xlsx file directly in TreBranch. Bring your existing models with you and start exploring scenarios immediately — no re-entry required.

📤

Export Any Scenario

Export the active scenario to .csv or Excel for clients, boards, or anyone who lives in Excel. Final outputs leave TreBranch cleanly — nothing to install on their end.

vs Parent Highlight

One toggle turns on cell highlighting for every value you've changed from the parent scenario. See your changes at a glance — green means you own it here.

Use Cases

Built for every scenario-heavy workflow.

Whether you're modeling a buyout or planning a coffee chain expansion, TreBranch removes the copy-sheet tax.

LBO & Private Equity

Model base, bull, and bear cases from a single source. Sweep entry multiples, generate sensitivity scenarios automatically, and show LPs exactly which assumption drives the difference.

  • Entry/exit multiple sweeps across a range in one click
  • Lock the signing-day version forever — and keep working
  • Compare Bull vs Bear down to the single growth assumption
  • Decision Sheet auto-compares IRR, MoM, MOIC across all scenarios
  • Probability-weighted returns across the whole case fan
Try the LBO template →
LBO model in TreBranch — scenario comparison tracing IRR difference to its driving assumptions

Healthcare & Hospital Planning

Model capacity scenarios — what happens if you add 2 ORs vs 4? What if patient volume grows 15%? Spin a scenario off your base plan and compare outcomes instantly.

  • Capacity expansion scenarios side-by-side
  • Staff:patient ratio sensitivity sweeps
  • Budget vs actual, tracked per scenario
  • Compare two department plans down to the driving headcount assumption
Try the Hospital template →
Hospital scenario planning in TreBranch — Decision Sheet across all scenarios

Startup Finance & FP&A

Fundraising scenarios, hiring plan sensitivities, runway calculations — model them all in one file. Show investors the bull/bear/base in a single, clean Decision Sheet.

  • Fundraise round scenarios (Seed, Series A, bridge)
  • Hiring plan scenarios with runway impact
  • Revenue model sensitivities (ACV, logo churn, expansion)
  • Board deck–ready Decision Sheet with one export
Try the Startup template →
Startup finance in TreBranch — Monte Carlo risk simulation on key assumptions

Operations & Retail

New store openings, pricing changes, supply chain scenarios — model every what-if without duplicating your entire model. Scenario the coffee chain expansion and let the numbers flow.

  • Store-level P&L scenarios connected to the company model
  • Price sensitivity sweeps across SKUs
  • Supply chain disruption scenarios
  • Seasonal demand what-ifs
Try the Ops template →
Operations modeling in TreBranch — sensitivity sweep branches

Corporate Strategy & M&A

Build/buy/partner scenarios, synergy modeling, integration planning — TreBranch handles the complexity so the strategy conversation can be about outcomes, not spreadsheet maintenance.

  • Build vs buy vs partner scenario tree
  • Synergy sensitivity with change tracking
  • Integration timeline scenarios
  • Management vs base case, compared in one click
Try the Strategy template →
♟️
M&A Strategy Template
Build/Buy/Partner · Synergies · Integration
Power Features

Tools you won't find in any other spreadsheet.

TreBranch ships with features built specifically for scenario modeling — things that should have existed in Excel 20 years ago.

Sensitivity Sweep

Right-click any input cell → Sweep. Set a range (e.g. growth rate 4%–14%). TreBranch auto-creates a scenario for every step — with a bar chart ready. Ten scenarios in 10 seconds.

Goal Seek (Solve)

Know the answer you need but not the input? Set a target — like "IRR ≥ 20%" — and Solve backs out exactly which growth rate, price, or margin gets you there.

Key Metrics

Mark any cell as a Key Metric and it shows up in the sidebar for every scenario — so you can see IRR, revenue, or payback across the whole tree without opening the model.

🔍

Compare Scenarios

Select any two scenarios and the Compare panel instantly lists every cell that changed — sorted by impact — and pinpoints the single root assumption driving the whole difference.

📊

Decision Sheet

One click opens a live side-by-side table of all your scenarios — Key Metrics, Key Assumptions, and charts together. The fastest way to present options to a room.

🕘

Full Model History

Every cell change is stored forever. Scroll back to any point in time and see exactly what the model looked like. Find the right moment? Turn it into a new scenario without touching current work.

📥

Import CSV & Excel

Open any .csv or .xlsx file in TreBranch. Bring your existing models with you — no re-entry needed. Your data comes in ready to explore.

📤

Export Any Scenario

Export the active scenario to .csv or Excel for sharing with anyone — no TreBranch required. Final outputs leave cleanly for clients, boards, or anyone who lives in Excel.

vs Parent Toggle

One button highlights every cell in the grid that differs from the parent scenario — green means you changed it here. See your changes at a glance, no separate panel needed.

Formula library

Formulas other spreadsheets don't have.

300+ standard functions — IRR, XIRR, NPV, SUMIFS, XLOOKUP, dynamic arrays that spill — plus a set you won't find in other popular spreadsheets.

XLOOKUPALL(key, range, return)

The wished-for lookup: returns every match, spilled as a column — not just the first hit.

XLOOKUPJOIN(key, range, return, ", ")

All matches joined in one cell — "Ann, Cy, Bob" — perfect for labels and summaries.

XLOOKUP2(key1, r1, key2, r2, return)

Two-criteria lookup in a single call. No helper columns, no INDEX/MATCH gymnastics.

MEDIANIFS · MODEIFS · QUARTILEIFS

The conditional statistics spreadsheets never shipped. Median deal size by sector, one formula.

STDEVIFS(range, criteria…)

Conditional volatility — standard deviation over exactly the rows that match.

WAVERAGE(values, weights)

Weighted average as a first-class function. Retire the SUMPRODUCT÷SUM ritual.

REGEXMATCH · REGEXEXTRACT · REGEXREPLACE

Real regular expressions over text — match, extract, and rewrite messy data with one formula.

EXTRACTNUMBER("$1,240/mo")

Pulls the number out of messy text → 1240. Pastes from PDFs become data.

COUNTUNIQUE(range)

Distinct count in one function — no SUMPRODUCT(1/COUNTIF()) incantations.

DATEADD(date, n, "m")

Date math that reads like English — add days, months, or years without EDATE edge cases.

NUMBERTOWORDS(1250)

"one thousand two hundred fifty" — for invoices, checks, and letters.

FILTER · UNIQUE · SORT · SEQUENCE

Full dynamic arrays that spill — and recalculate across every scenario and point in time.

Every formula works in every scenario — change an assumption and the whole tree recalculates.
The copy-sheet tax

What do duplicate scenario tabs cost you?

Every fix applied to one copy has to be re-applied to all the others. Put your numbers in — this runs entirely on this page.

96hours / year
$14,400of analyst time

Replace the copies — Try Free for 7 Days
One file that holds every scenario, instead of N copies. Buy once, own it forever.
7-day free trial included

Try TreBranch free for 7 days.

Then buy once — yours forever.
No subscription. No cloud lock-in. Sold through the Microsoft Store.
  • Unlimited scenarios in one file
  • Compare, Sweep, Goal Seek, Decision Sheet, Risk simulation
  • Full formula library (FILTER, XLOOKUP, REGEX*, and more)
  • Works 100% offline — no cloud required
  • .trebranch file format — fully offline
  • LBO, Hospital, Coffee Chain starter templates
Get it on Microsoft Store
Windows 10/11 · Sold & secured by Microsoft Store · ~8 MB
Articles

Guides & tutorials.

Scenario modeling best practices, TreBranch walkthroughs, and financial analysis ideas — straight to the point.

Browse articles →
Contact

Send us a message.

Questions, feedback, or suggestions? We read every message and reply to every one.