The problem with the annual budget
The annual budget has a structural flaw that has nothing to do with how carefully it was built: its horizon shrinks every single day. A plan approved in December offers twelve months of forward visibility in January and two months of it by November. The moment you most need to know what next year looks like — while setting headcount, signing leases, committing to supplier contracts — is precisely when the budget has the least to say.
The second flaw is that most budgets are built by extrapolation. Each general-ledger line gets last year's actual plus a growth or inflation percentage. This bakes in last year's mistakes, and worse, it produces a plan nobody can interrogate. Ask why the marketing line is the size it is and the honest answer is "because that's roughly what we spent last year." There is no causal model underneath, so when reality diverges there is no way to say which belief was wrong.
None of this means budgets should be abolished. They serve a real purpose as a commitment device and an accountability bar, and the Beyond Budgeting movement's stronger claim — that the annual budget should be scrapped entirely, as Handelsbanken famously did in the 1970s — remains a minority practice for good reasons. The workable middle position at most companies is to keep the budget for what it is good at, and to steer the business with something else.
What a rolling forecast actually is
A rolling forecast is a forecast whose horizon never shortens. Rather than stopping at fiscal year end, it always looks the same distance forward — typically 12 to 18 months — and is re-cut on a fixed cadence, adding a new period at the far end as each closed period drops off the front.
The mechanical change is small. The behavioural change is not. Under an annual budget, the question in a monthly review is "are we on plan?", which is a question about the past. Under a rolling forecast the question becomes "what do we now think the next twelve months look like, and what are we going to do about it?", which is a question about decisions still available to you.
| Annual budget | Rolling forecast | |
|---|---|---|
| Horizon | Shrinks to zero across the year | Constant, 12–18 months |
| Built from | Last year's GL lines plus a percentage | Operational drivers |
| Updated | Once a year, defended thereafter | Monthly or quarterly |
| Central question | "Are we on plan?" | "What do we do next?" |
| Revision means | Someone missed | New information arrived |
The cultural prerequisite: a rolling forecast only works if revising the number is treated as information rather than as failure. If forecast revisions get litigated like missed commitments, your team will learn to submit forecasts that are politically safe rather than accurate, and you will have built an expensive machine for producing the budget again.
Driver-based planning: the foundation
Rolling forecasts only pay off if the model underneath is driver-based. Re-cutting an extrapolated budget every month just means being wrong more frequently.
Driver-based planning means modelling the operational quantities that cause the financial result, then deriving the financials from them. Rather than forecasting a support-cost line directly, you model customers, tickets per customer, minutes per ticket, and cost per agent-hour. Rather than forecasting revenue as a growth rate, you model pipeline, win rate, average deal size, and churn.
Three things fall out of this that you cannot get any other way:
- Variances become explanations. When revenue misses, you can say whether volume, price, or mix caused it — because each is a separate driver, not a blended output.
- Scenarios become cheap. A downside case is a change to two or three drivers, not a hand-edit across forty GL lines.
- The model is interrogable. Anyone can ask "what are we assuming about win rate?" and get a number, rather than a shrug.
The discipline that makes this stick is ruthlessness about which drivers matter. Every driver you model is a driver somebody has to maintain and defend monthly. A model with a dozen genuine drivers beats one with ninety, and the way to find the dozen is to run a sensitivity analysis and keep only what actually moves the outcome.
The scenario layer: how many cases, and which
Here is where most FP&A functions overbuild. The instinct when facing uncertainty is to add another case, and then another, until the team is maintaining seven forecast versions and reconciling them consumes the cycle.
The practical standard is three named cases, plus triggers:
- Base case. What you actually expect — not a sandbagged number, not a stretch. If your base case is deliberately conservative, every decision downstream is distorted and nobody can tell by how much.
- Upside case. What happens if the things you are trying to make happen, happen. This one earns its keep in capacity planning: it tells you when you would need to hire ahead of demand.
- Downside case. Not the apocalypse — a plausible bad year. Its job is to answer "at what point do we have a cash problem?" with a date.
Then, instead of a fourth and fifth named case, attach contingency plans to observable triggers: "if bookings are below X for two consecutive months, we pause the second tranche of hiring." A trigger is more useful than a scenario because it is pre-agreed, it names the action rather than just the number, and — critically — it costs nothing to maintain.
The multiplication trap: every named case must be re-cut every cycle. Three cases re-forecast monthly is thirty-six model updates a year. Seven cases is eighty-four. The marginal decision value of cases four through seven is almost always lower than the maintenance cost, and the maintenance cost is paid in the exact week your team is busiest.
Why FP&A scenario models drift faster than deal models
Every part of finance that keeps multiple scenario copies suffers from version drift — a fix applied to one copy and not the others, until the cases differ by accumulated maintenance rather than by deliberate strategy. We have written about the general anatomy of that failure before. But it is materially worse in FP&A, for three structural reasons.
1. The cycle repeats forever
A deal model lives for weeks and then closes. An FP&A model lives for years and is edited every month. Each cycle brings actuals to load, a structural change to absorb — a new cost centre, a product line, a reorganisation — and a correction or two. Each is an opportunity to update two copies out of three. Drift does not need a mistake; it only needs repetition and one distracted month.
2. Actuals overwrite forecast, in every copy
FP&A models have a moving boundary between actuals and forecast that advances every close. That boundary has to advance identically in every scenario copy. When it does not — when the downside case still has September as forecast while the base case has it as actual — the two are no longer comparable, and the discrepancy is nearly invisible because both files look perfectly normal on their own.
3. Many hands
Deal models usually have one owner. FP&A models are touched by business partners across functions, each maintaining their slice. The more editors, the lower the odds that a structural change reaches every copy in the same cycle.
Put together, this means the standard defences underperform badly here. Reviewing the base case carefully does not tell you the downside case has quietly diverged. The error is not in a model; it is between models.
Closing the loop: variance analysis that feeds the forecast
The step that converts a rolling forecast from a reporting exercise into a management system is connecting variance analysis back to drivers. A variance report that says revenue was $400k under plan is nearly useless. One that decomposes it is not.
| Component | Question it answers | What it implies |
|---|---|---|
| Volume | Did we sell fewer units? | Demand or pipeline problem — revisit the volume driver |
| Price | Did we sell at lower prices? | Discounting or competitive pressure — revisit price realisation |
| Mix | Did we sell a different blend? | Often the most actionable and the most overlooked |
| Rate (cost) | Did inputs cost more per unit? | Supplier, wage, or FX movement |
| Efficiency (cost) | Did we consume more inputs per output? | Operational issue, not a purchasing one |
Because each component maps to a driver, the variance conversation and the reforecast become the same conversation. You are not explaining the past in one meeting and revising the future in another; you are updating the belief that was wrong. That is the entire point of building the model driver-based in the first place.
A monthly operating rhythm that works
A cadence most teams can actually sustain, assuming a monthly close:
- Days 1–3: load actuals. Advance the actuals boundary — in every scenario, identically.
- Days 3–5: decompose variance. Volume, price, mix, rate, efficiency. Name the drivers that were wrong.
- Days 5–8: revise drivers. Update the base case drivers that the variance analysis just falsified. Resist the urge to revise drivers that were merely noisy.
- Days 8–10: re-cut scenarios. Upside and downside inherit the driver corrections and keep only their deliberate differences.
- Days 10–12: review and act. Present the three cases side by side, check triggers, decide.
Step 4 is where teams lose days. If your upside and downside are separate workbooks, re-cutting them means manually re-applying everything from step 3 to each one and hoping nothing is missed. This is the single biggest sink of analyst time in a rolling-forecast process, and it is pure overhead — it produces no insight whatsoever.
The structural fix
Steps 1 through 3 and step 5 are analytical work worth paying for. Step 4 is not — it exists only because the tool forces one copy per scenario.
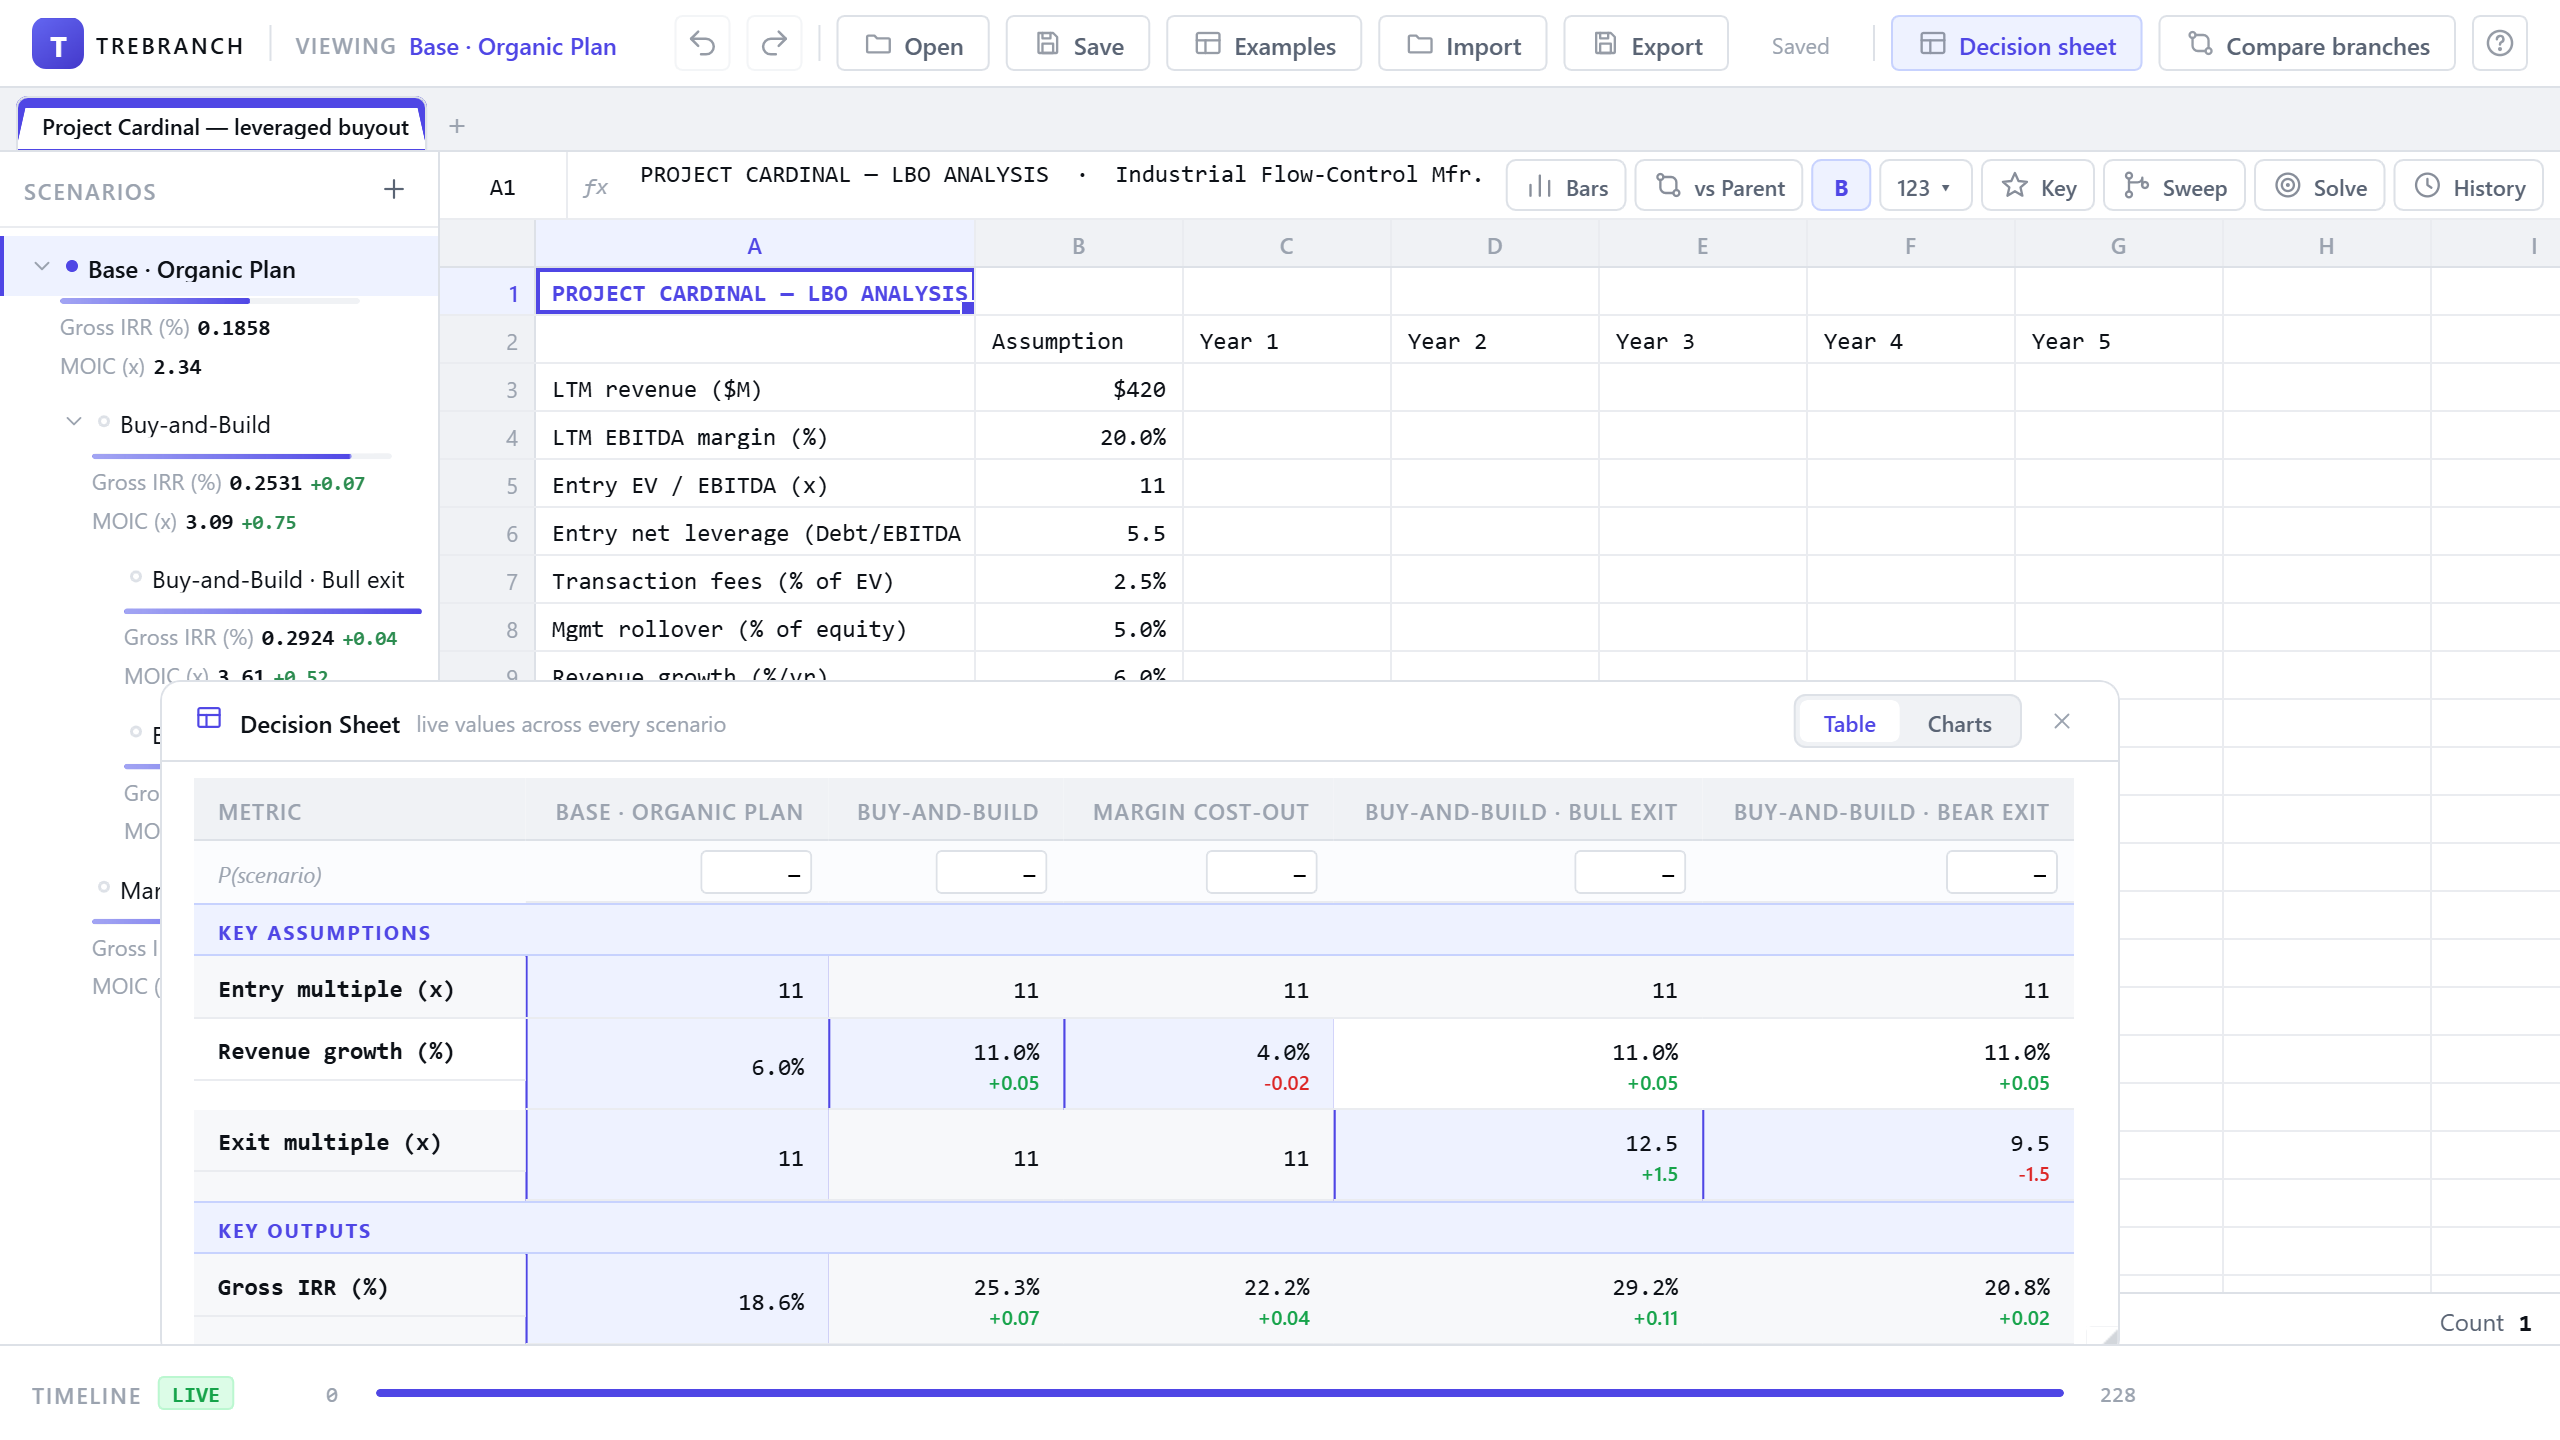
That is what branching removes. When each case is a branch of one live model rather than a separate workbook, it inherits every cell from its parent and overrides only the handful of drivers that genuinely make it an upside or a downside. Load actuals once on the trunk and all three cases have them. Correct a driver once and the correction propagates, except where a case has deliberately overridden it. The actuals boundary cannot advance unevenly, because there is only one boundary.
The review exhibit stops being assembled by hand too. When every case lives in one file, a side-by-side of key drivers and key outputs across all scenarios is generated, not built — and it is never stale, because it reads the live model. The same is true of the question that always comes up in the meeting: "why is the downside $2M worse?" Comparing two branches answers it in one click, with each differing output traced to the driver responsible, rather than turning into an action item for next week.
One model. Every scenario. No re-cutting.
TreBranch is Git for spreadsheets. Your base, upside, and downside are branches of a single live model — load actuals once, correct a driver once, and every case stays in sync except where you deliberately overrode it. Compare any two branches to see every difference traced to its driver, run Monte Carlo risk simulation on any case, and open a Decision Sheet that lines up every scenario for the review. Built for the month-end cycle, not for deal weeks.
Get TreBranch — $9.99 →$9.99, one time. Yours forever. 100% offline — your models never leave your computer.
Frequently Asked Questions
What is a rolling forecast?
A rolling forecast is a forecast that always looks the same distance into the future rather than stopping at the fiscal year end. A typical implementation keeps 12 to 18 months of forward visibility and re-cuts the forecast every month or quarter, adding a new period at the far end as each closed period drops off the front. The point is that the planning horizon never shortens: in a traditional annual budget, by October you are managing against a plan with only two months left in it, while a rolling forecast in October still shows you the next twelve. It does not replace the budget for accountability or compensation purposes at most companies, but it does replace it as the number the business actually steers by.
How is driver-based planning different from traditional budgeting?
Traditional budgeting builds each general-ledger line from last year's number plus a growth or inflation percentage, which means the budget encodes the previous year's mistakes and nobody can explain why a line is the size it is. Driver-based planning instead models the operational quantities that actually cause the financial result, then derives the financial lines from them. Instead of budgeting marketing spend at last year plus five percent, you model leads required, cost per lead, and conversion rate, and the spend falls out. The practical payoff is that when reality diverges you can say which driver was wrong, and a scenario becomes a change to one driver rather than a hand-edit across dozens of GL lines.
How many scenarios should an FP&A team maintain?
Three named cases plus a small number of trigger-based contingencies is the practical standard. The three are typically a base case representing what you actually expect, an upside case, and a downside case. Adding a fourth and fifth named case rarely improves the decision and reliably multiplies the maintenance burden, because every case must be updated each time the underlying model changes. What adds more value than extra named cases is continuous sensitivity on the two or three drivers that move the outcome most, plus pre-agreed contingency plans attached to observable triggers rather than to whole extra forecast versions.
How often should you reforecast?
Monthly reforecasting is the norm for companies whose conditions change quickly, and quarterly is common in more stable industries. The right cadence is set by how fast your assumptions actually go stale, not by convention. A useful test is to look back at your last several reforecasts: if the revisions were consistently small and directionally random, you are reforecasting more often than your business changes and the effort is not buying information. If each reforecast moves the number materially, you are probably not reforecasting often enough. The cost side matters too, because a reforecast that takes three weeks of analyst time cannot sensibly be run monthly.
What is the difference between a budget, a forecast, and a scenario?
A budget is a commitment: it is approved, it is usually tied to accountability and sometimes compensation, and it is deliberately held still so that performance can be measured against a fixed bar. A forecast is an estimate: it is your current best view of what will actually happen, and it is expected to change as information arrives. A scenario is a conditional: it describes what the numbers become if a specific set of assumptions holds, and several scenarios can exist at once without any of them being wrong. Confusion between the three is a common source of organizational friction, particularly when a forecast revision is treated as a failure to hit budget rather than as new information.
How do you do variance analysis between budget and actuals?
A useful variance analysis decomposes the gap into causes rather than just reporting its size. On the revenue side the standard decomposition splits the variance into volume, price, and mix components, which separates selling fewer units from selling them cheaper from selling a different blend of products. On the cost side the equivalent split is usually rate versus efficiency, separating paying more per unit of input from consuming more inputs per unit of output. The discipline that makes this work is that each component should tie back to a driver in the model, so the variance explanation and the forecast revision are the same conversation rather than two separate exercises.
Why do FP&A scenario models drift out of sync?
Because the FP&A cycle repeats monthly while the scenario copies are maintained by hand. Each close brings new actuals, a structural change such as a new cost centre or product line, and a correction or two, and all of those must be applied to the base case, the upside, and the downside separately. Miss one copy in one month and the cases silently stop being comparable, because they now differ by both the strategic assumptions you changed deliberately and the maintenance you applied unevenly. Deal modelling has the same failure mode but a shorter exposure window, since a deal model lives for weeks. An FP&A model lives for years and is edited every single month, so the drift compounds.